The aim for deggust R-package is to visualise designs constructed from the edibble R-package. The visualisation are ggplot graphics.
(WIP)
Installation
The development version from GitHub with:
# install.packages("devtools")
devtools::install_github("emitanaka/deggust")
Recipe experimental designs
You can see deggust::autoplot() used in various edibble designs at https://emitanaka.org/edibble-book/cookbook.html. Some samples are below.
Examples
fac <- takeout(menu_factorial(trt = c(3, 2)))
fac
#> start_design("Factorial Design") %>%
#>   set_units(unit = 42) %>%
#>   set_trts(trt1 = 3,
#>            trt2 = 2) %>%
#>   allot_trts(~unit) %>%
#>   assign_trts("random", seed = 440) %>%
#>   serve_table()
#>
#> # Factorial Design
#> # An edibble: 42 x 3
#>          unit     trt1     trt2
#>  * <unit(42)> <trt(3)> <trt(2)>
#>  1     unit1     trt12    trt21
#>  2     unit2     trt11    trt22
#>  3     unit3     trt13    trt22
#>  4     unit4     trt11    trt21
#>  5     unit5     trt12    trt21
#>  6     unit6     trt11    trt22
#>  7     unit7     trt12    trt21
#>  8     unit8     trt13    trt22
#>  9     unit9     trt13    trt21
#> 10     unit10    trt13    trt21
#> # … with 32 more rows
autoplot(fac)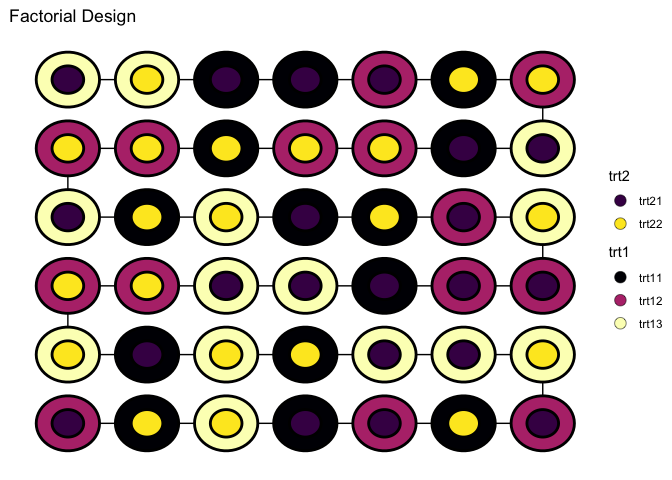
hyper_graeco <- takeout(menu_hyper_graeco(t = 6))
hyper_graeco
#> start_design("Hyper-Graeco-Latin Square Design") %>%
#>   set_units(block1 = 6,
#>             block2 = 6,
#>             block3 = 6,
#>             block4 = 6,
#>             unit = ~block1:block2:block3:block4) %>%
#>   set_trts(trt = 6) %>%
#>   allot_trts(trt ~ unit) %>%
#>   assign_trts("random", seed = 253) %>%
#>   serve_table()
#>
#> # Hyper-Graeco-Latin Square Design
#> # An edibble: 1,296 x 6
#>       block1    block2    block3    block4       unit      trt
#>  * <unit(6)> <unit(6)> <unit(6)> <unit(6)> <unit(1k)> <trt(6)>
#>  1   block11   block21   block31   block41     unit1      trt3
#>  2   block12   block21   block31   block41     unit2      trt6
#>  3   block13   block21   block31   block41     unit3      trt1
#>  4   block14   block21   block31   block41     unit4      trt5
#>  5   block15   block21   block31   block41     unit5      trt2
#>  6   block16   block21   block31   block41     unit6      trt4
#>  7   block11   block22   block31   block41     unit7      trt1
#>  8   block12   block22   block31   block41     unit8      trt3
#>  9   block13   block22   block31   block41     unit9      trt4
#> 10   block14   block22   block31   block41     unit10     trt2
#> # … with 1,286 more rows
autoplot(hyper_graeco)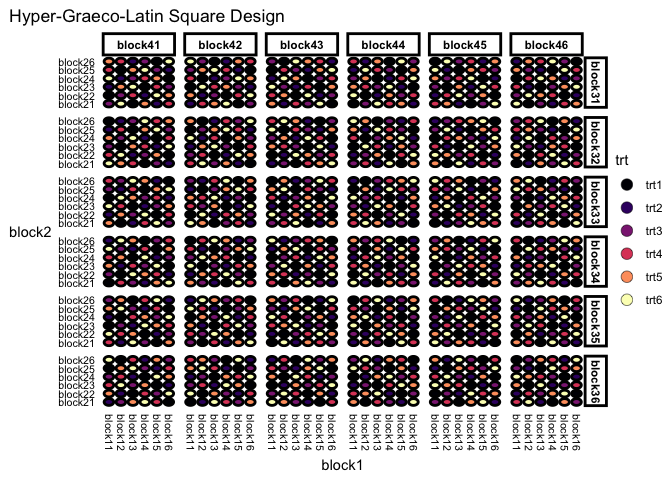
Automatic look into the design layout:
unit1 <- start_design(name = "One unit") %>%
    set_trts(trt = 4) %>%
    set_units(unit = 16) %>%
    allocate_trts(trt ~ unit) %>%
    randomise_trts() %>%
    serve_table()
#> Warning: `randomise_trts` is deprecated. Please use `assign_trts("random")`
#> instead.
#> Warning: `allocate_trts` is deprecated. Please use `allot_trts` instead.

autoplot(unit1)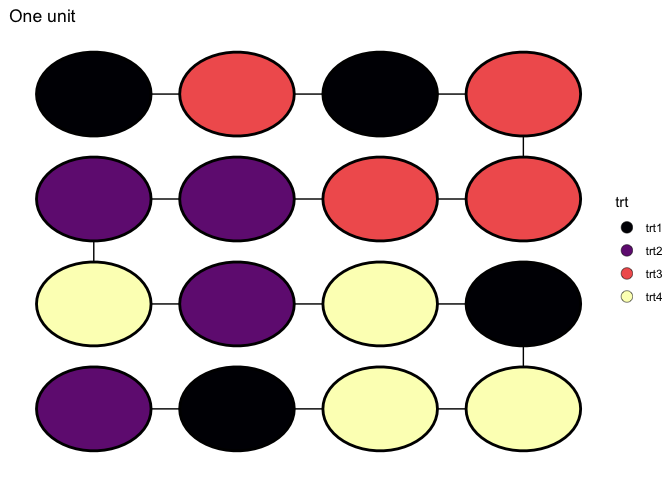
Easy to replace the unit shape:
autoplot(unit1, shape = "box")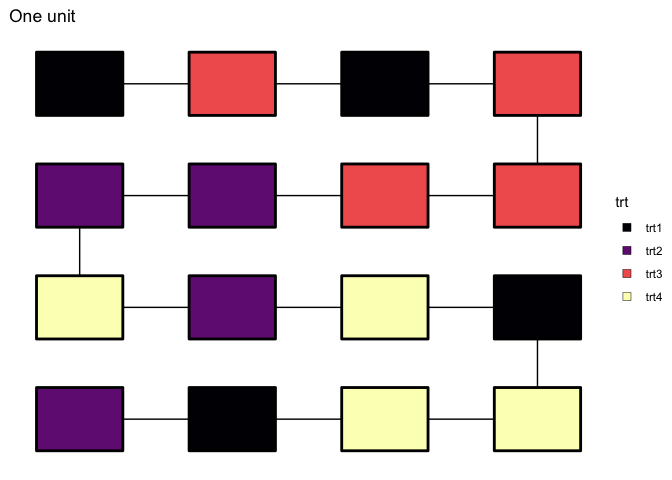
autoplot(unit1, shape = "triangle")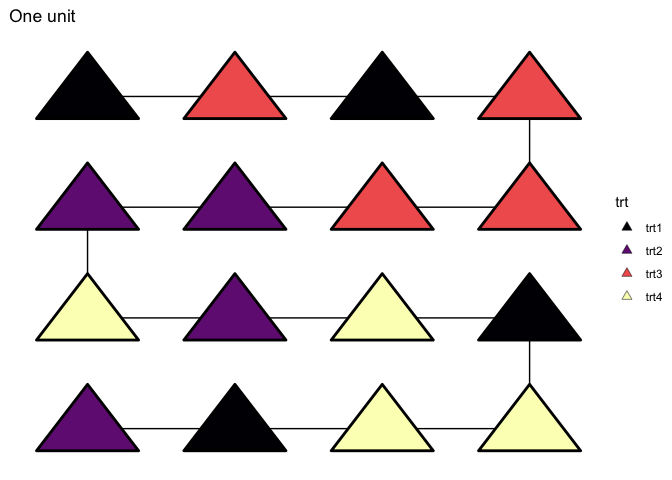
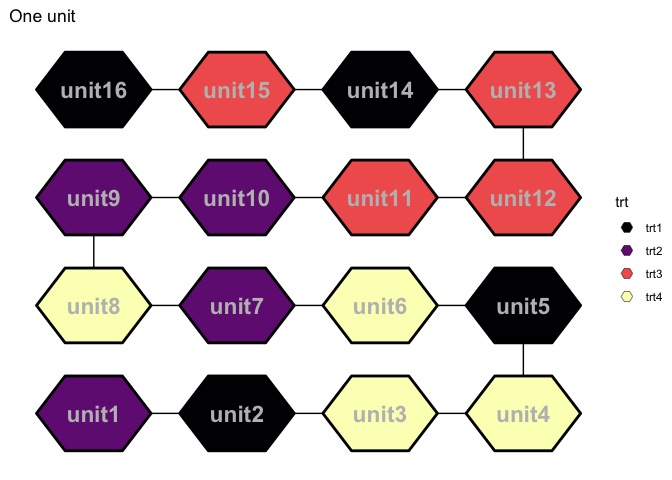
autoplot(unit1, shape = "hexagon",
         text = element_text(size = 6,
                             color = "gray",
                             face = "bold"))